Here are some examples of the work created by students on Tuesday 18 January as part of their attempts to generate information to solve the problem set by our Work Based Learning contact Ditto Press.
Thanks to the students for letting me display their work.
They worked from the workshop brief set out below.
More next week.
Karl
Mountains from Molehills - Pattern via Data
More and more information is being visualised. Diagrams, data and information graphics are utilised wherever increasingly complex elements are present, whether it is in magazines, non-fiction books or business reports, packages or exhibition designs. Today, diagrams are being applied beyond their classical fields of use. In addition to archetypical diagrams such as pie charts and histograms, there are manifold types of diagrams developed for use in distinct cases and categories. These range from chart-like diagrams such as bar, plot, line diagrams and spider charts, graph-based diagrams including line, matrix, process flow, and molecular diagrams to extremely complex three-dimensional diagrams. The more concrete the variables, the more aesthetically elaborate the graphics – sometimes reaching the point of art – the more abstract, the simpler the readability.
Briefing:
You will be working in groups today to solve the problems set. Everyone must make an effort to contribute to the three Exercises. Remember to photograph the results of this assignment for your records.
Exercise 1
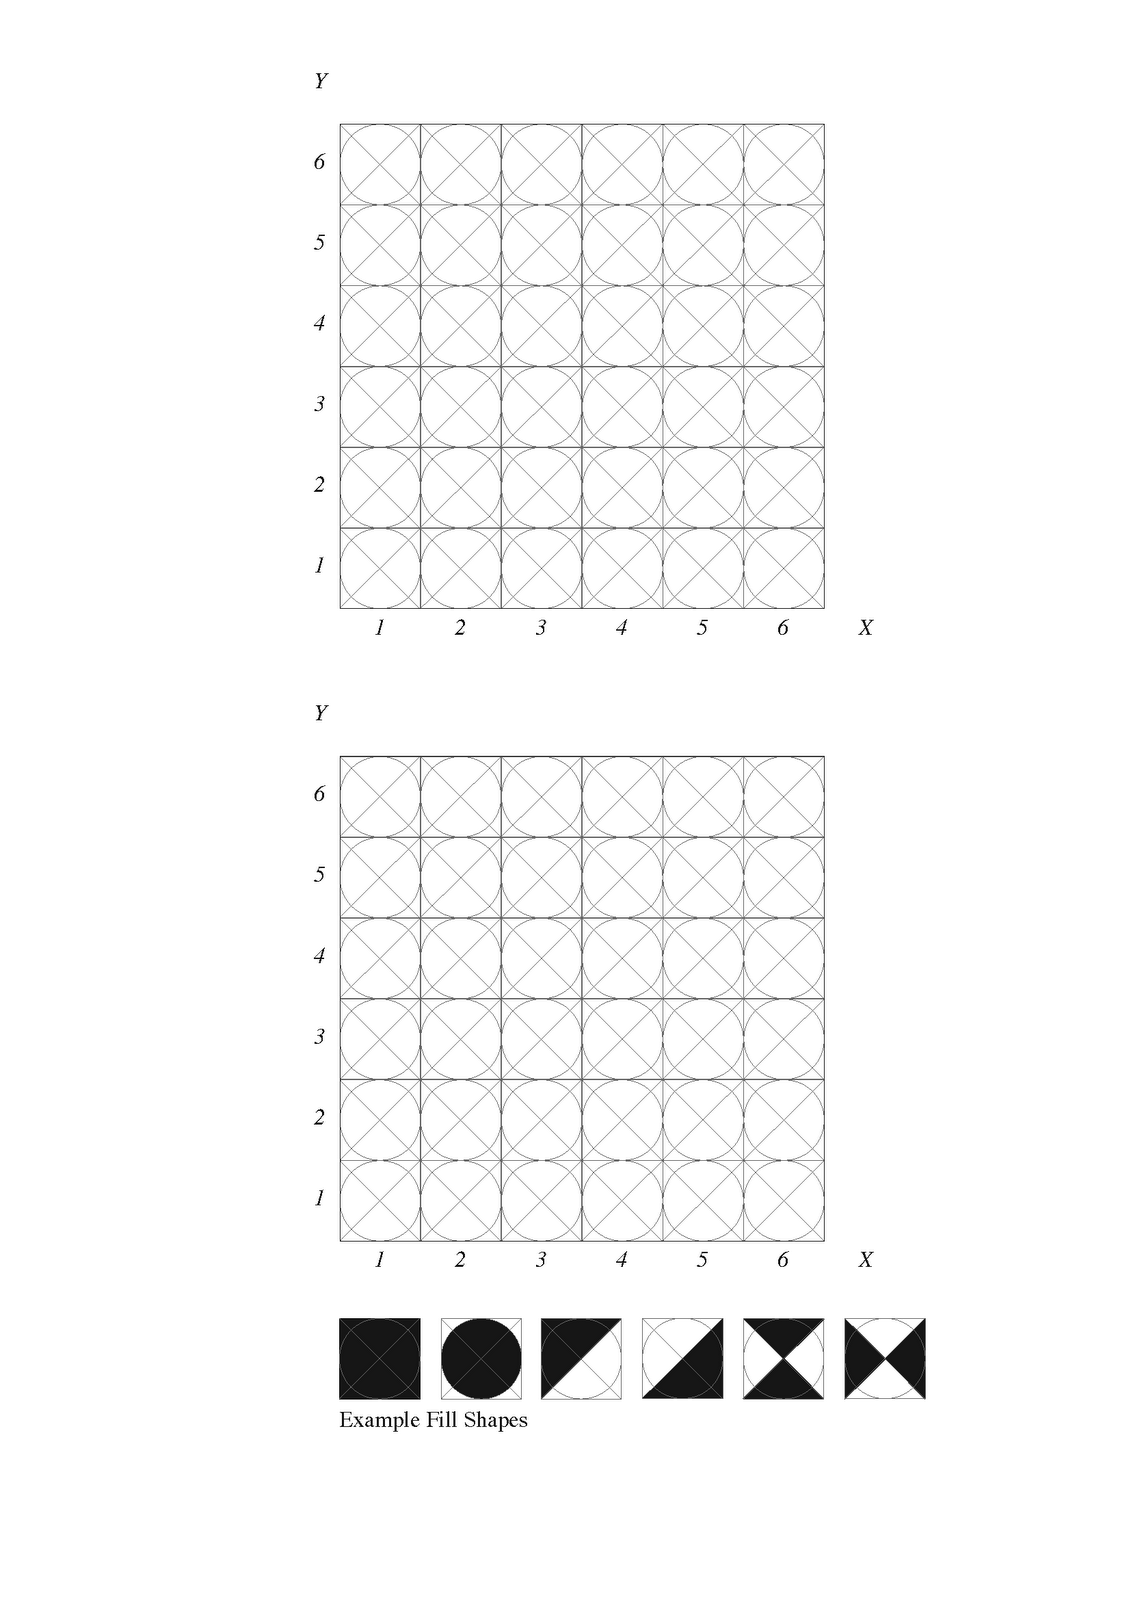
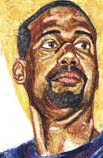
You are required to create a minimum of 6 Tile designs using random Data Use the worksheet and dice supplied to generate these designs.
To find the square on the on the grid sheet that you should fill in first roll dice A to get the X co-ordinate then roll dice B to get the Y co-ordinate. Continue like this until you have filled a total of 12 of the 24 squares on each grid. This means you should roll each dice 12 times. You need to repeat this action 5 more times to get your minimum 6 Tile designs. Each tile should look individual.
Please note the examples of the Fill shape you can place in the selected squares of the grid. You can adapt this if you wish.
Exercise 2
You now have 6 Tile designs. Looking at worksheet 2 use the 6 Tile designs to help you present the Data given in each of three examples in a visually interesting manner.
Please note there maybe some mathematical inconsistencies in the Data when you add it up. What could be the reason for this?
Exercise 3
The Ditto Press are looking for ideas and well as striking images that show the potential of the Risograph process. Select one of the examples from Exercise 2 and develop this further into a more sophisticated graphic solution.
Click on the two images below for greater detail.

No comments:
Post a Comment